
One clear goal
Produce a replenishment plan from your own stock snapshot and sales totals, with visible calculations and validation issues.
Prepare your CSV files
Extract the ZIP and open index.html in a current browser. Load the fictional example to see the format. You can paste CSV text or choose files. Use comma-separated UTF-8 CSV with these headers:
- Stock:
sku,on_hand,on_order,backorders,lead_time_days,safety_stock,moq,pack_size - Sales:
sku,quantity
Use whole, non-negative units for all stock and sales values; pack size must be at least 1. Lead time and observation/review periods use whole days. Values and aggregated sales per SKU are limited to 1 billion. Use zero for no orders, backorders, safety stock or minimum order quantity. SKU values are case-sensitive and outer whitespace is trimmed. Stock must have one row per SKU. Multiple sales rows are summed.
Calculate and review
- Ensure sales include only the stated observation period; the tool does not filter dates. Remove cancelled orders and handle returns according to your own consistent sales definition before importing.
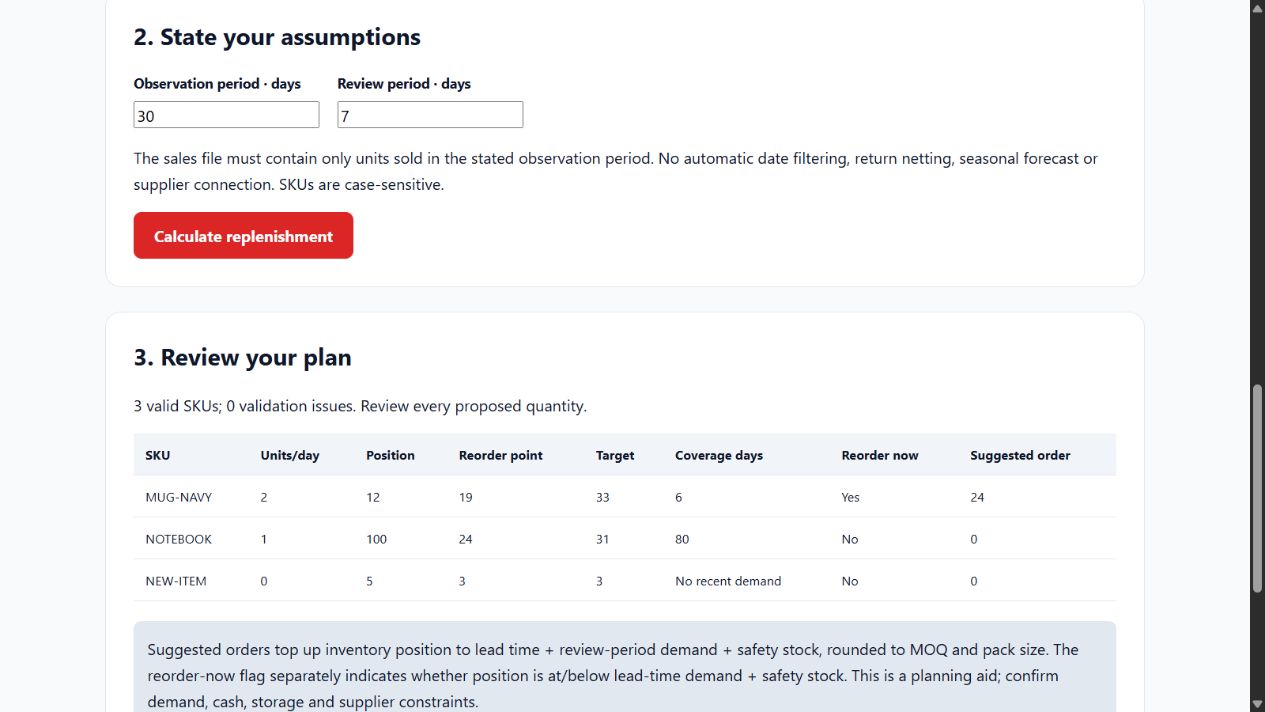
- Enter the observation period (for example, 30 days) and review period (for example, 7 days between purchasing reviews).
- Choose Calculate replenishment. Review the plan and validation issues. The screen previews the first 100 SKUs/issues; downloads include all.
- Download the plan CSV and audit JSON. Keep the original files and assumptions with the report.
The calculations
- Daily demand = sales units / observation days.
- Inventory position = on hand + on order − backorders.
- Reorder point = daily demand × lead time + safety stock.
- Target stock = daily demand × (lead time + review period) + safety stock.
- Suggested order = positive shortfall to target, rounded up to whole units, at least MOQ, then rounded up to a pack multiple. If no shortfall, order zero.
- Coverage days = max(0, on hand − backorders) / daily demand. Zero observed demand displays No recent demand, not infinite coverage.
- Reorder-now flag = inventory position at or below reorder point.
The suggested quantity is a periodic top-up; it can be positive even when the reorder-now flag is No. The flag is a separate lead-time warning. Decide when to place the order using your purchasing policy.
For the sample MUG-NAVY, 60 units / 30 days = 2 per day. Position is 12. Reorder point is 2 × 7 + 5 = 19; target is 2 × 14 + 5 = 33. The shortfall is 21; MOQ 12 and pack size 6 give a suggested order of 24. Coverage is 6 days.
Validation and limits
Duplicate stock SKUs are excluded entirely; invalid stock rows and sales with no valid stock match are reported. Any malformed sales row blocks the whole plan, avoiding silently understated demand. Correct every issue before relying on the result. Unknown extra columns are ignored; the specified headers remain required.
Full download: 5 MB and 50,000 nonblank data rows per CSV. Hub demo: 20 rows per CSV. CSV/text only; no XLSX, live inventory, currency valuation, fractional units, warehouses, seasonal forecasting or supplier integration. Demand averages do not account for stockouts, trends or abnormal events. Confirm cash, storage and supplier constraints yourself.
CSV exports prefix formula-like values (=, +, -, @) with an apostrophe, including negative positions, for spreadsheet safety. JSON retains numeric values. No files are uploaded, saved in browser storage or sent to suppliers.
Purchase and support
£39 once includes version 1.0.0, editable source, tests, fictional samples, guide, internal-business-use licence and 90 days of installation support. Future versions and bespoke forecasts are not promised. Support: support@mmd-solutions.co.uk.
Source and current version
This documentation is generated from the tool’s own versioned guide. See the current Hub guide and tool page for availability and release details.